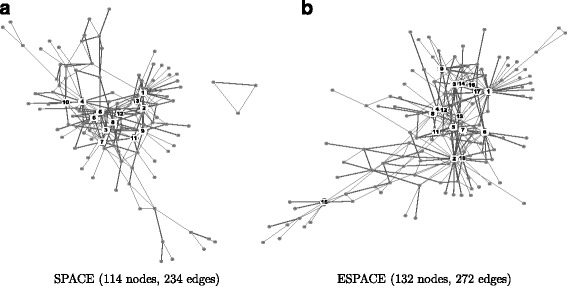
Fig. 5.

Estimated networks structure using the SPACE and ESPACE methods. The nodes with more than 7 connections (the 0.95 quantile in the degree distribution) were defined as hub nodes, which are represented as black nodes in the network structure. The details of hub genes are reported in Table 7. a SPACE (114 nodes, 234 edges) and b ESPACE (132 nodes, 272 edges)
