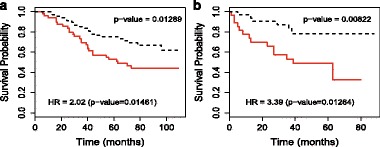
Fig. 6.

Kaplan-Meier curves for the CDKN3 gene from GSE13213 and GSE1037 datasets. For each gene, we divide patients into two groups, “High” and “Low”, by their gene expression levels with the K-means clustering method. Red solid lines denote the “High” group and black dashed lines denote the “Low” group. a CDKN3 (GSE13213 dataset) and b CDKN3 (GSE1037 dataset)
