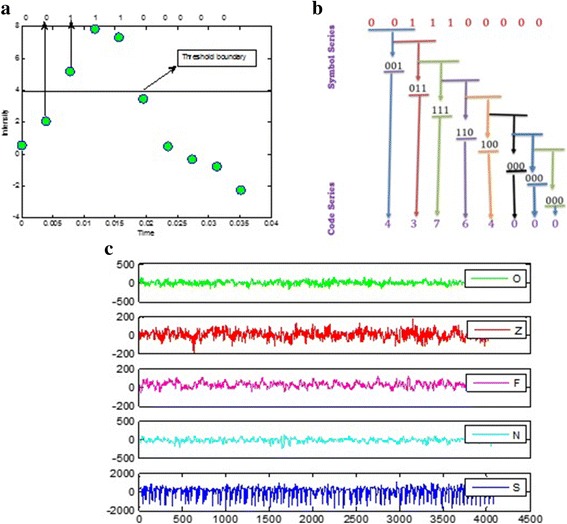
Fig. 1.

Symbolic time series analysis and EEG time series plots of five datasets. a EEG time series separated by threshold and conversion into binary series. b Data symbolization process. c Exemplary EEG time series from each of the five sets. From top to bottom: set O to set S (denoted EEG-O to EEG-S). Amplitudes of the surface EEG recordings are typically in the order of some μV. For intracranial EEG recordings, amplitudes range around some 100 μV. For seizure activity, these voltages can accede 1000 μV
