Fig. 3.

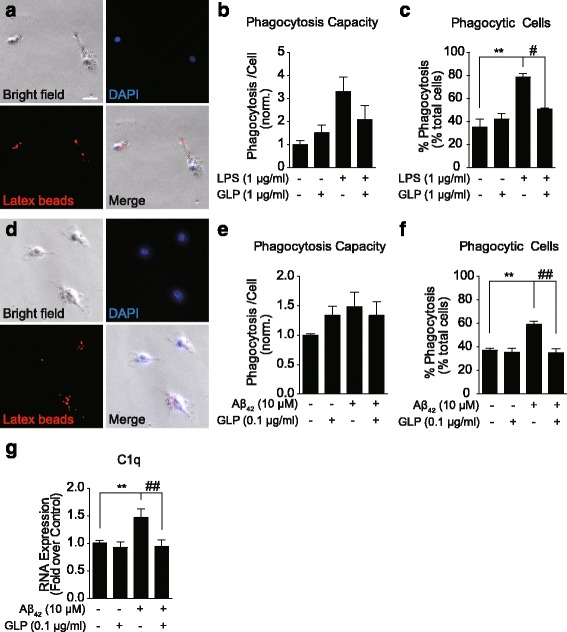
GLP inhibited LPS- and Aβ-induced phagocytosis in microglia. The effect of GLP on the LPS- (a–c) and Aβ-induced (d–f) phagocytosis in BV2 (a) and primary mouse microglia (d), respectively. The phagocytosis capacity was expressed as the ratio of total areas of fluorescent signals to the total numbers of phagocytic cells (b, e). GLP reduced the proportions of phagocytic cell resulted from LPS and Aβ activation (c, f). The complement C1q mRNA expression was quantified in primary microglia and GLP inhibited the Aβ-promoted C1q expression (g). Values expressed are mean ± SEM for at least three independent experiments. Images of phagocytosis were captured from 16–30 fields per well of cells. Statistical analysis was performed using one-way ANOVA with Tukey’s multiple comparison test, differences from untreated cells (*) and LPS- or Aβ-stimulated condition (#) were revealed (compared with control: **p < 0.01; compared with LPS- or Aβ-stimulated condition: # p < 0.05 and ## p < 0.01)
