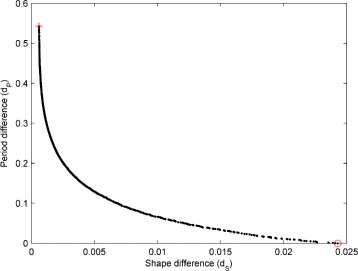
Fig. 6.

Example estimated Pareto front obtained by optimising the model to experimental nystagmus waveform A of Fig. 4. The red circle indicates the solution with the minimum period difference (equal to zero in this case) from the experimental oscillation, selected as the best individual; the corresponding fit to the experimental waveform can be seen in Fig. 11a. The red cross marks the solution with the minimum shape difference; the corresponding fit is shown in the left plot of Additional file 1: Figure S20A
