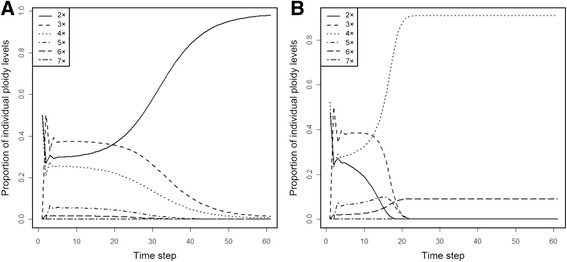
Fig. 2.

Examples of predicted time course of proportions of individual ploidy levels. Plants are assumed to be monocarpic with no clonal growth (Simple Model) and are parameterized with the data from the crossing experiment. a The initial proportion of diploids:tetraploids 0.5:0.5. b The initial proportion of diploids:tetraploids 0.45:0.55. These proportions have been selected to illustrate that small changes in initial proportions are predicted to lead to very different outcomes. For the full mapping of the space of initial conditions, see Fig. 3
