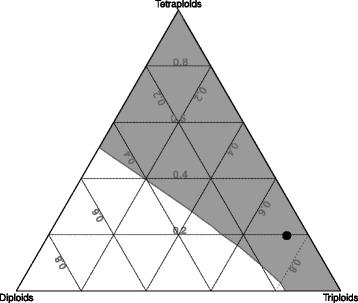
Fig. 3.

Final cytotype structure as a function of initial proportions of individual cytotypes. Different shading indicates regions in the space of the initial proportion of diploids, triploids and tetraploids that end in the stable state I (white region) and the stable state II (grey region) in the Simple Model parameterized by the field data. The triangular representation is used as proportion of diploids, triploids and tetraploids sum to one. The whole region of initial values was mapped using a step of 0.02; each combination of initial values was run for 200 steps (generations) to determine which stable state (Table 3) it is approaching. The black dot indicates the approximate position of the field population
