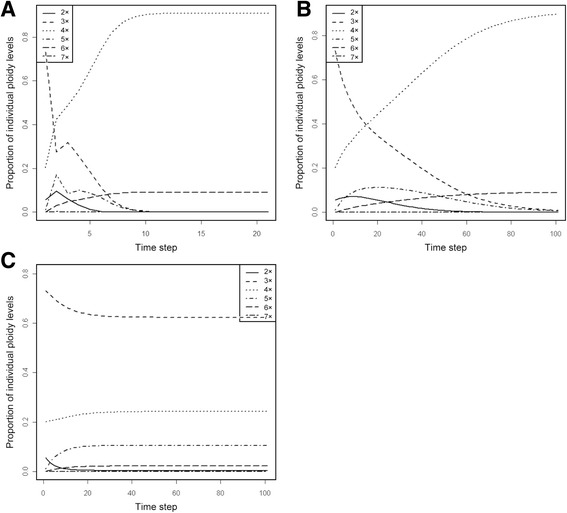
Fig. 4.

Predicted time course of proportions of individual ploidy levels starting with proportions found at locality. a plants are monocarpic with no clonal growth (Simple Model); b plants are perennial and clonal, clonal growth of all ploidy levels is identical (Clonal Model, g = 0.1); c plants are perennial and clonal, clonal growth of triploids is 1.2 times that of tetraploids and of diploids 0.8 times that of tetraploids (Clonal Model, g = 0.1, c 2 = 0.8, c 3 = 1.2). Note different scaling of the x axis. Hybridization data in all models are parameterized by the experiment
