Fig. 1.

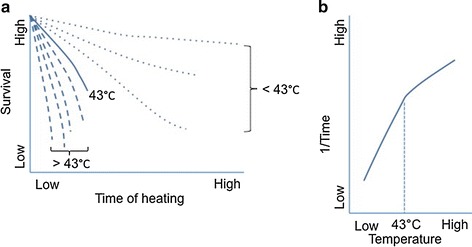
a Typical graph of survival curve of a cell line which is heated at different temperatures for various durations, b typical graph of Arrhenius plot with a break point at around 43 °C

a Typical graph of survival curve of a cell line which is heated at different temperatures for various durations, b typical graph of Arrhenius plot with a break point at around 43 °C