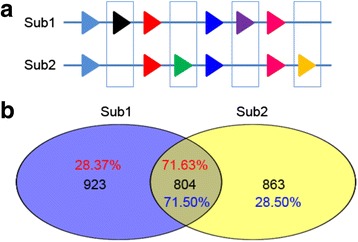
Fig. 3.

Fractionation of duplicated gene pairs in S. indicum subgenomes. a. Fractionation of duplicated gene pairs on syntenic regions within Subgenome1 and Subgenome2. Line represents genomic regions collinear between the S. indicum subgenomes. Identical colored triangless represent syntenic gene pairs. Boxes represent fractionation of duplicated gene pairs. b. Function divergence indicated by InterPro entries. Venn diagram indicates relationships between genes and InterPro entries of asymmetric retained genes in duplicated gene pairs. The integer indicates number of InterPro entries of asymmetric retained genes in duplicated gene pairs. The percentage represents the proportion of gene numbers with InterPro entries to total genes in Subgenome1 or Subgenome2
