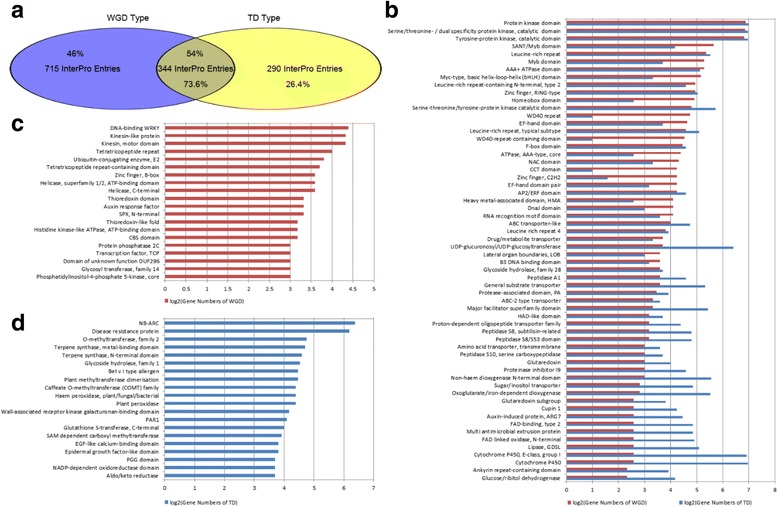
Fig. 5.

Functional differences of gene pairs from WGD and TD events. a. Functional differences of gene pairs from WGD and TD events by InterPro entries. Venn diagram shows the numbers of genes and InterPro entries of different gene pairs from WGD and TD events. The integer indicates the number of InterPro entries of different gene pairs. The percentage numbers represent the proportion of gene numbers in different gene pairs with InterPro entries to total genes from WGD or TD event. b. Comparison of InterPro entries of different gene pairs from WGD and TD events. Red bars represent the numbers after Log2 normalization of duplicated gene pairs from WGD event. Blue bars represent the numbers after log2 normalization of paralogous gene pairs from TD event. c. The specific InterPro entries of duplicated gene pairs from WGD event. Red bars represent the numbers after log2 normalization of duplicated gene pairs. d. The specific InterPro entries of paralogous gene pairs from TD event. Blue bars represent the numbers after Log2 normalization of paralogous gene pairs
