
Table 4.
Cytokines/chemokines expression profile in mouse tissues
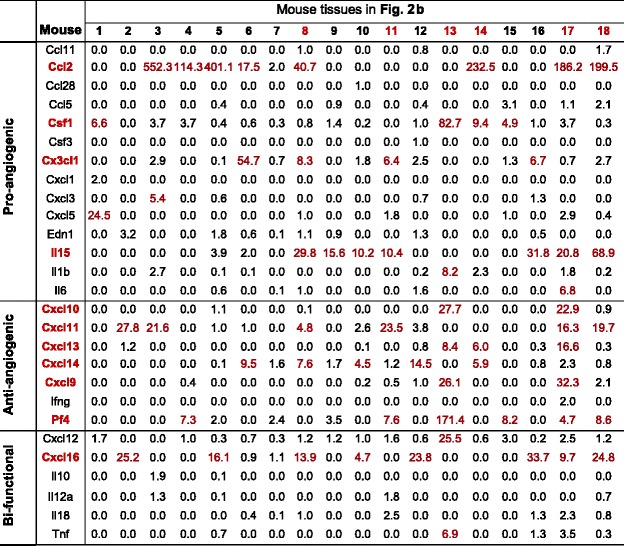
IDs for 18 mouse tissues are the same as Fig. 2b. mRNA relative expression levels of C/Cs higher than threshold are texted red. C/Cs highly expressed in more than the median number of tissues among all are considered as abundant C/Cs (red text). Tissues with more than median number of C/Cs being highly expressed among all are considered as tissues with high angiogenic responses (red text)