


Table 8.
Gene expression changes of cytokines/chemokines in vascular diseases, metabolic diseases, and autoimmune diseases
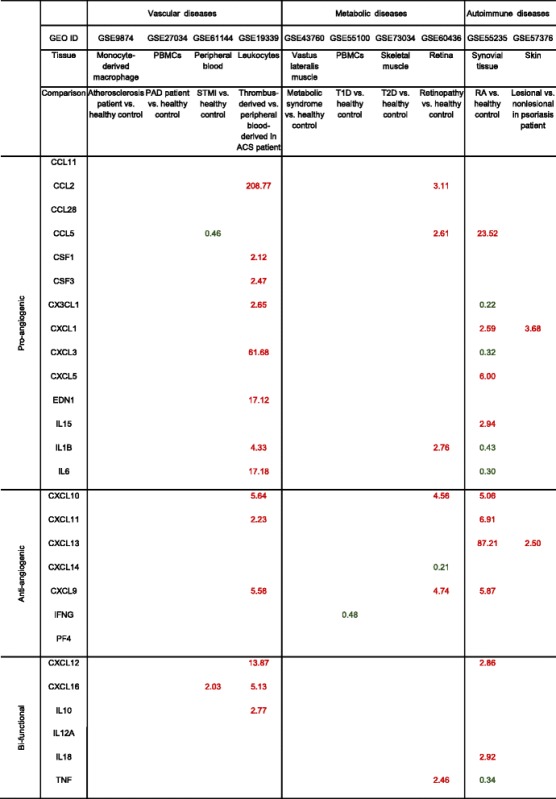
Twenty-seven cytokines/chemokines are investigated using the method we developed (Fig. 1b). We compared gene expression level in different tissues to their parallel controls. Genes with significant expression changes (p < 0.05) are shown here. Red text stands for upregulation (FC ≥ 2), and green text stands for downregulation (FC ≤ 0.5)