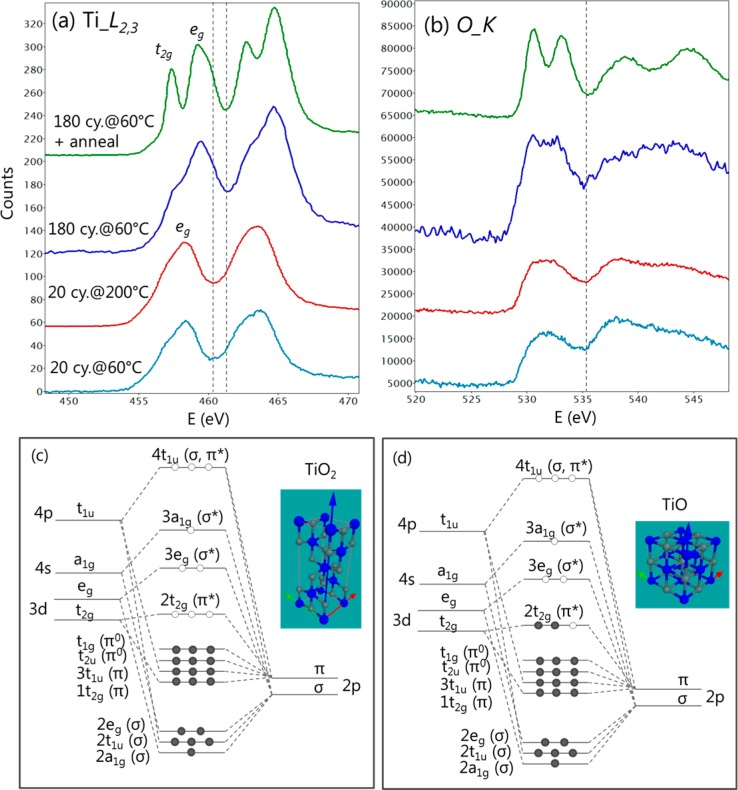
Figure 4.
(a and b) EELS spectra showing the Ti_L2,3 and O_K edges, acquired from the ALD titania on SLG after 20 cycles at 60 °C, 20 cycles at 200 °C, and 180 cycles at 60 °C and after in situ annealing at 400 °C, respectively. The dashed lines in panel a denote the ∼1 eV energy shift due to different oxidation states of Ti. (c and d) Molecular orbitals for anatase TiO2 and rocksalt TiO (adapted from ref (23)), together with their unit cell of the crystal lattice. The main difference is the occupancy of the 2t2g (π*) state, which explains the edge features in the EELS spectra.

