
Figure 3.
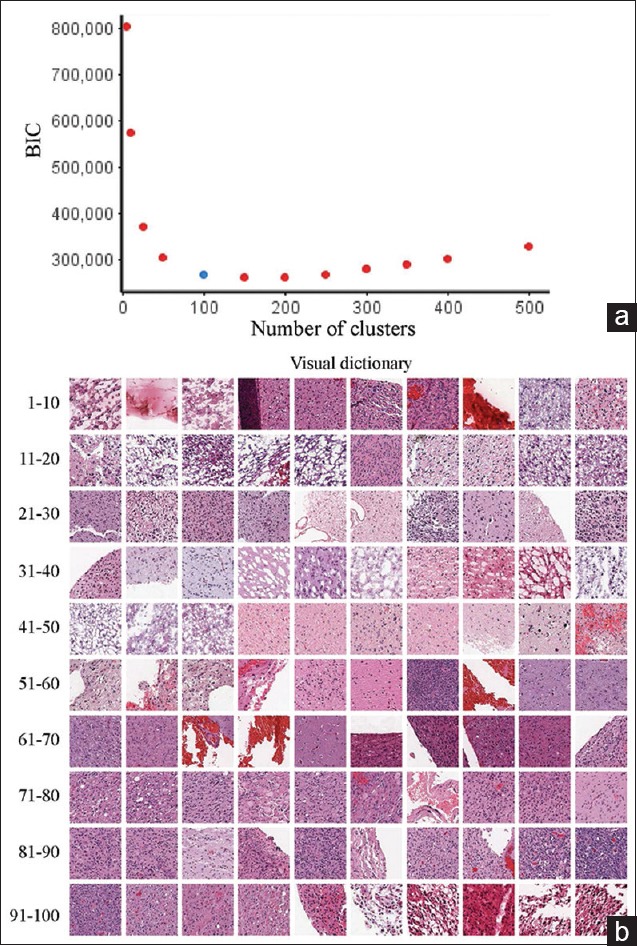
Visual dictionary optimization and visualization. (a) To determine the optimal size of the dictionary, the Bayesian information criterion was calculated from a putative range of potential numbers of clusters and plotted. The knee point is at approximately 100 clusters; therefore, this was the dictionary size used in the subsequent analysis. (b) The visual dictionary was then compiled by selecting tiles that had the nearest Euclidean distance to the centroid of each cluster. Tiles are shown in cluster order (1–10, 11–20, etc.)