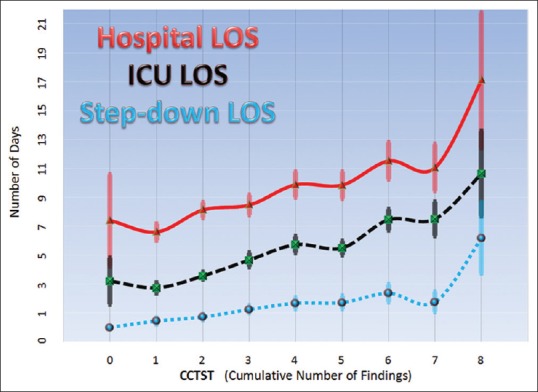
Figure 2.

Relationships between cranial computed tomography scoring tool and hospital (red line – top), Intensive Care Unit (black dashed line – middle), and step-down (blue dashed line – bottom) lengths of stay are shown. Data are displayed as means with standard error bars
