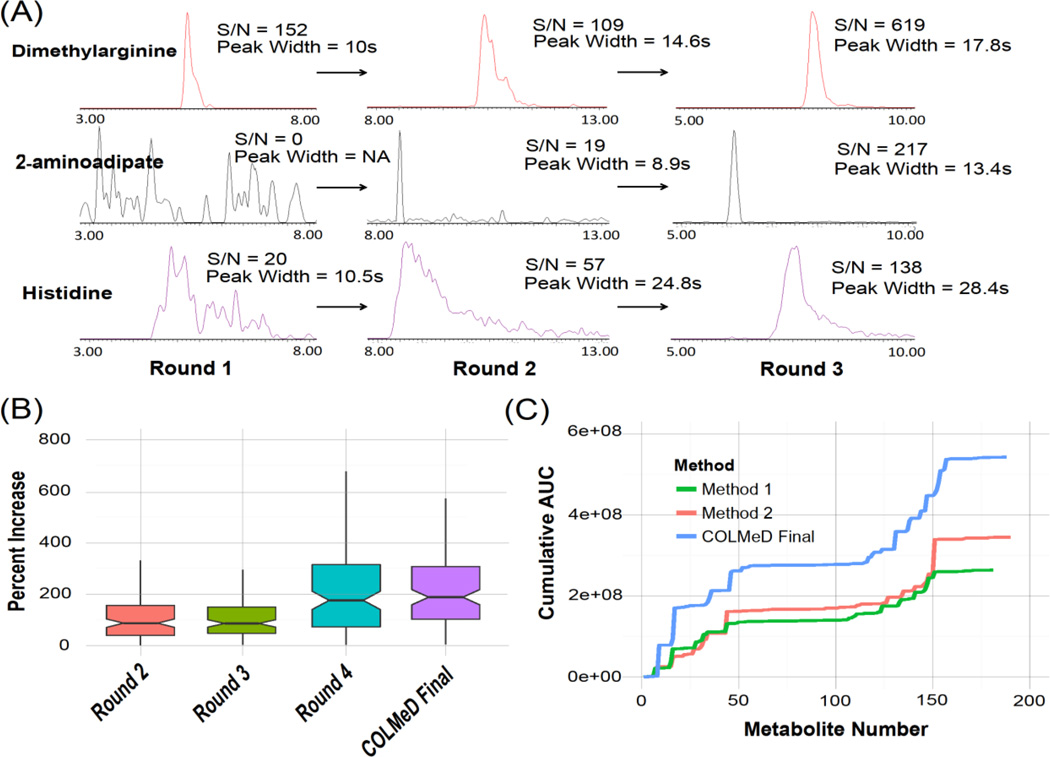
Figure 2.
(a) Chromatographic improvement in selected metabolites after three rounds of DoE in the QqQ COLMeD process. Signal-to-noise (S/N) and peak width (full width half height) measurements were generated from vendor software after limited peak smoothing and integration. (b) Percent response increase by metabolite across each round. (c) Cumulative AUC plots for QqQ COLMeD benchmarking

