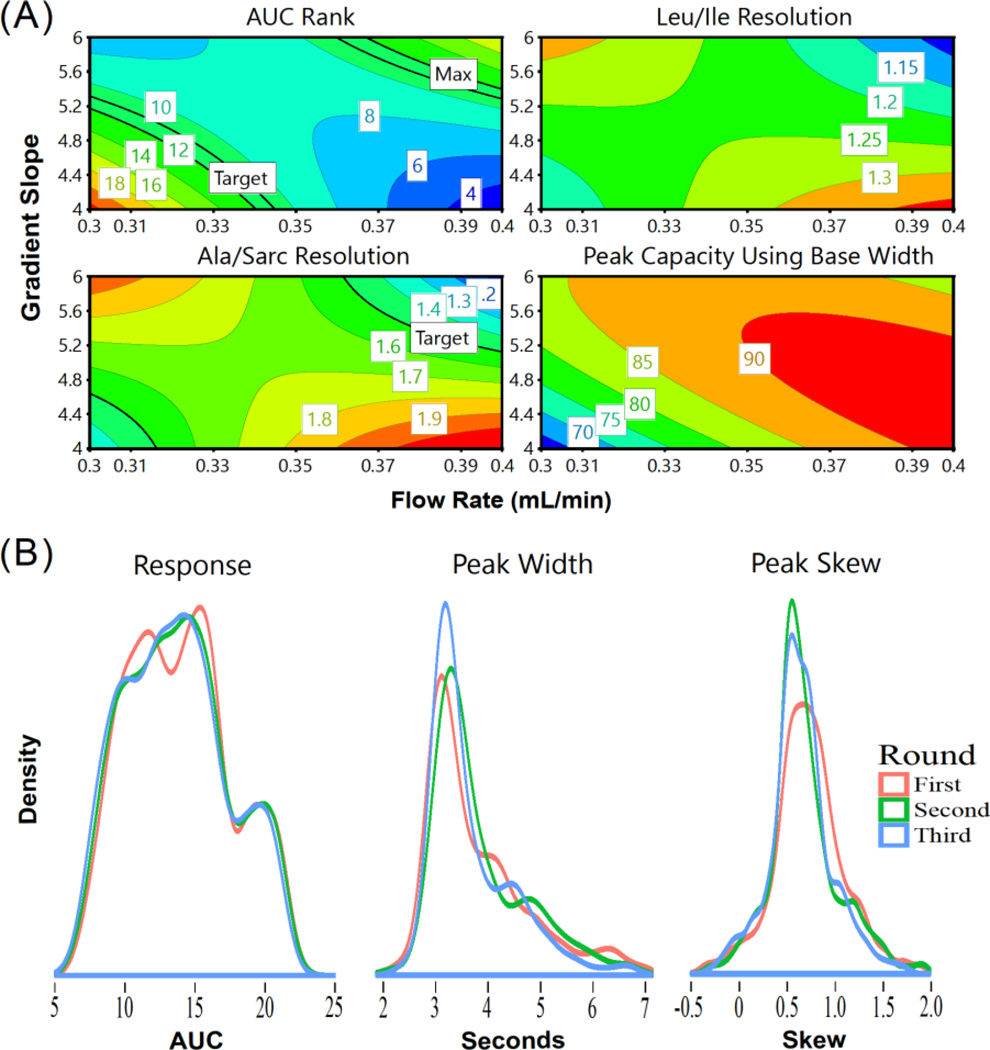
Figure 4.
(a) Response contour plots after Round 3 of LC DoE for un-targeted qTOF metabolomics, demonstrating the tradeoffs to be considered in finding a method optimum. (b) Decreased spread of peak widths and peak skews (with a target objective of 4 seconds widths and minimized skews) across three rounds. These improvements are without compromising the MS response (depicted here as log-transformed AUC values)

