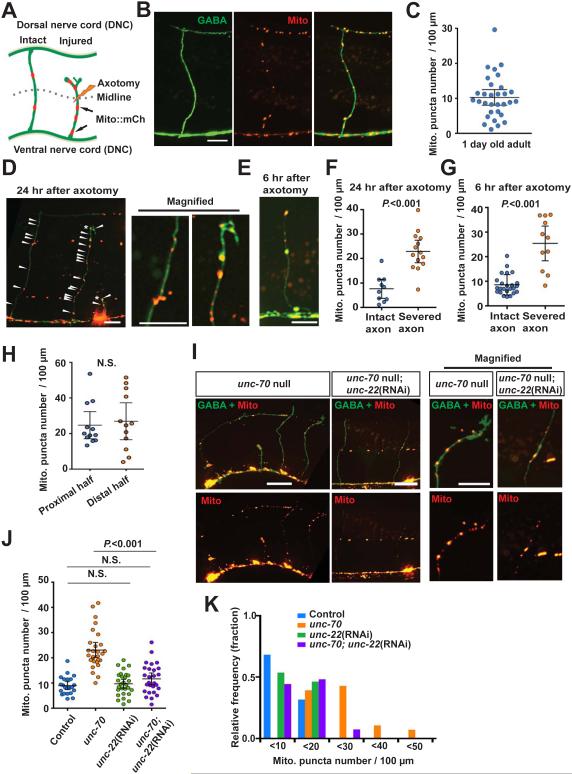
Figure 1. Axon injury increases mitochondria density in the injured axon.
(A) Diagram of C. elegans GABA motor neurons showing mitochondria in intact and severed axons.
(B) Mitochondria in intact GABA axons of adult control animals. Arrowheads indicate individual mCherry puncta; mCherry is conjugated to the mitochondrial targeting sequence of TOM-20. Scale bar is 10 μm.
(C) Scatter plot showing mitochondria density in individual intact GABA axons. Each dot indicates a single axon. Number of scored axons is 32.
(D and E) Mitochondria in GABA neurons at 24 hours after axotomy (D) and at 6 hours after axotomy (E). The right panels are magnified images of boxed areas. Asterisks indicate the tip of the regenerating axon. Arrowheads indicate individual mCherry puncta. Scale bars are 10 μm.
(F and G) Scatter plot showing mitochondria density in individual GABA axons at 24 hours after axotomy (F) and at 6 hours after axotomy (G). Dots indicate individual axons. Error bars indicate 95% confidence interval. Statistical significance was calculated by the Mann–Whitney test.
(H) Scatter plot showing mitochondria density in the proximal half (below DV, closer to the cell body) and the distal half (over D/V, further from the cell body) of regenerating GABA axons 12 hours after injury. Dots indicate individual axons. Error bars indicate 95% confidence interval. Statistical significance was calculated by the Mann–Whitney test.
(I) Mitochondria in GABA neurons of unc-70(s1502) mutants. The right panels are magnified images of boxed areas. Asterisks indicate the tips of the regenerating axons. Arrowheads indicate individual mito-mCherry puncta. Scale bars are 20 μm.
(J) Scatter plot showing mitochondria density in GABA axons of indicated animals. Dots indicate individual axons. Error bars indicate 95% confidence interval. Statistical significance was calculated by the Mann–Whitney test.
(K) Binned frequency graph showing mitochondria density in the GABA axons of controls and unc-70(s1502) mutants. In each interval, a color-coded bar shows the fraction of axons with the given mitochondrial density.

