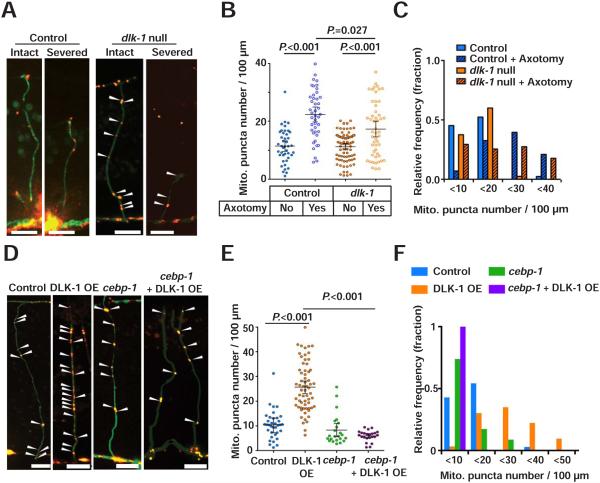
Figure 7. DLK-1 regulates mitochondria density in axons.
(A) Representative micrographs of mitochondria in the GABA axons of dlk-1(ju476) mutants at 24 hours after axotomy. Arrowheads indicate single Mito::mCherry puncta. Scale bars are 10 μm.
(B) Scatter plot showing mitochondria density in GABA axons 24 hours after axotomy. Dots indicate individual axons. Error bars indicate 95% confidence interval. Statistical significance was calculated by the Mann–Whitney test. N.S. indicates not significant.
(C) Binned frequency graph showing mitochondria density in GABA axons 24 after axotomy. After axotomy, compared to control (6.9%), dlk-1 null mutant (29.4%) show higher fraction of axons with mitochondrial density <10 in the injured axons.
(D) Mitochondria in uninjured GABA axons. Arrowheads indicate single Mito::mCherry signals. Scale bars are 10 μm.
(E) Scatter plot showing increased mitochondria density in GABA axons due to DLK-1 overexpression. Dots indicate individual axons. Lines indicate means and error bars indicate 95% confidence interval. Statistical significance was calculated by the Mann–Whitney test.
(F) Binned frequency graph showing mitochondria density in intact GABA axons of given animals.

