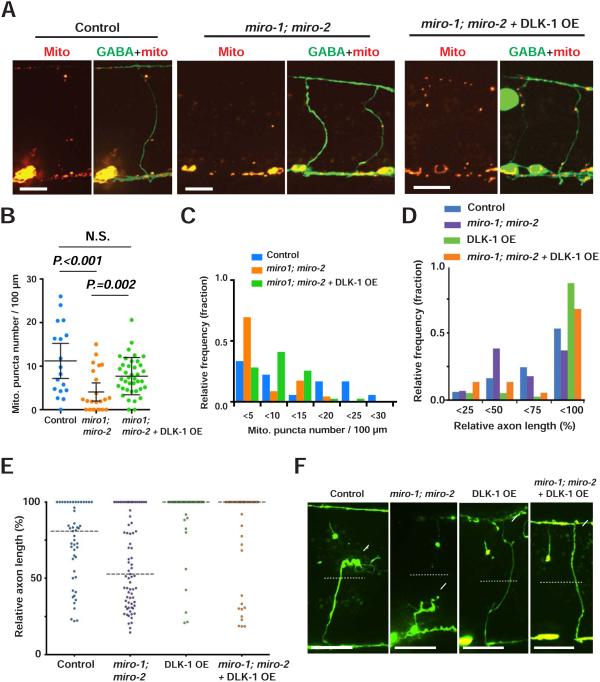
Figure 8. DLK-1 overexpression functions independently of Miro.
(A) Mitochondria in GABA neurons of given animals. Arrowheads indicate individual Mito:: mCherry puncta. Scale bars are 10 μm.
(B and C) Scatter plot (B) and binned frequency graph (C) of mitochondria density of GABA axons 24 hours after axotomy. Dots in (B) indicate individual axons and error bars indicate average ± 95% confidence interval. Statistical significance was calculated by the Mann–Whitney test.
(D and E) Binned frequency graph (D) and scatter plot (E) showing relative axon length of given animals 24 hours after axotomy. Dashed lines in (E) indicate median. Statistical significance was calculated by Mann–Whitney test.
(F) GABAergic axons 24 hours after axotomy in given animals. Arrows indicate axon tips. Asterisks indicate distal stumps that confirm axotomy. Scale bars are 20 μm.

