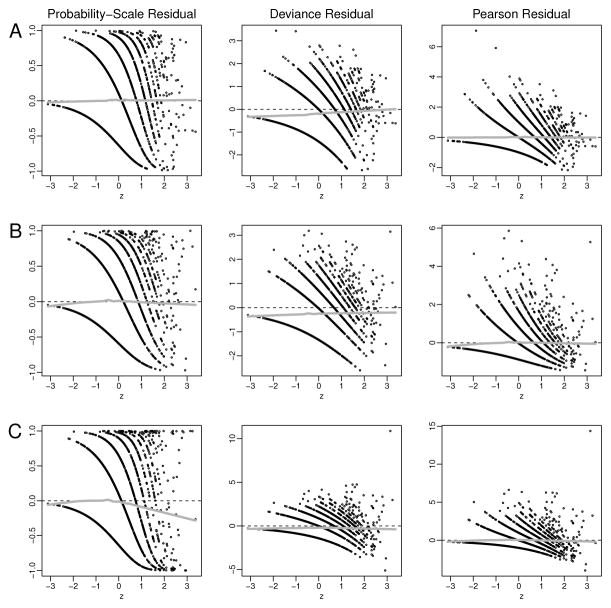
Figure 4.
Plots of the PSR (first column), deviance (middle column), and Pearson (last column) residuals versus Z for 2000 data points generated under A) a Poisson model and analyzed with a Poisson model, B) a negative binomial model and analyzed with a negative binomial model, and C) a negative binomial model and analyzed with a Poisson model. Smoothed curves using Friedman’s ‘super smoother’ are added.

