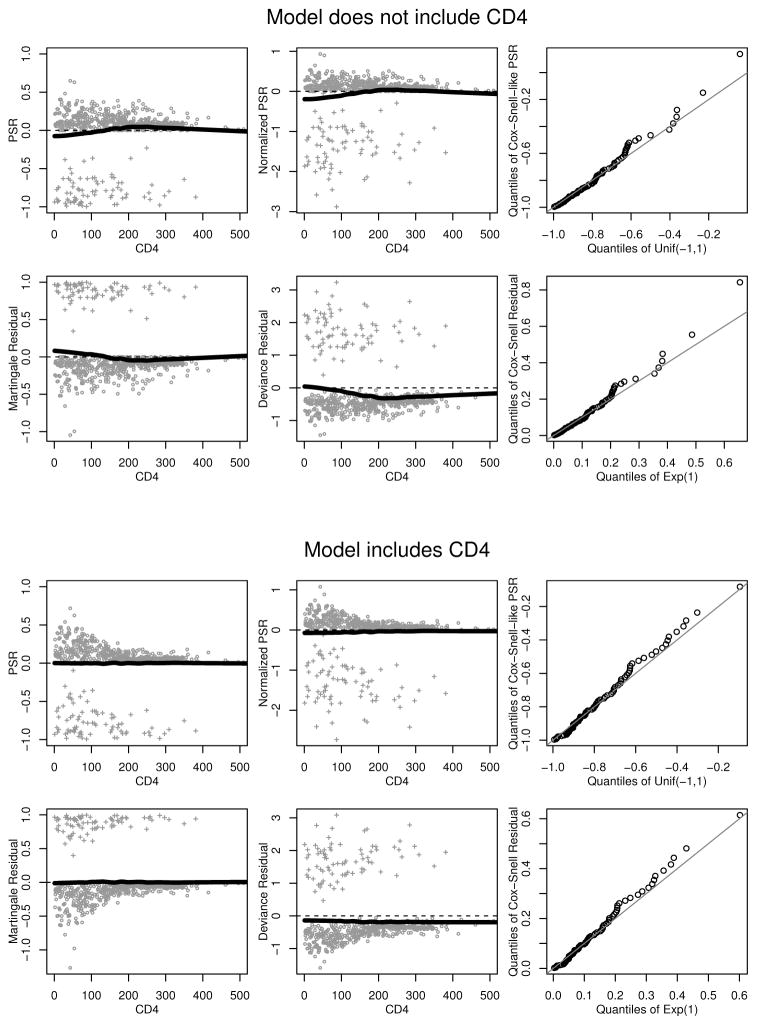
Figure 5.
Residual plots for models of the time to death. Rows 1–2 are for a model that does not include CD4, rows 3–4 are for a model that includes CD4. Rows 2 and 4 correspond to traditional residual plots using martingale, deviance, and Cox-Snell residuals, respectively. Rows 1 and 3 correspond to analogous plots using the PSR. The plots in columns 1 and 2 are limited to CD4<500 as this includes >98% of all measurements. Smoothed curves using Friedman’s ‘super smoother’ are added. Observed events are denoted with crosses, censored are denoted with circles.

