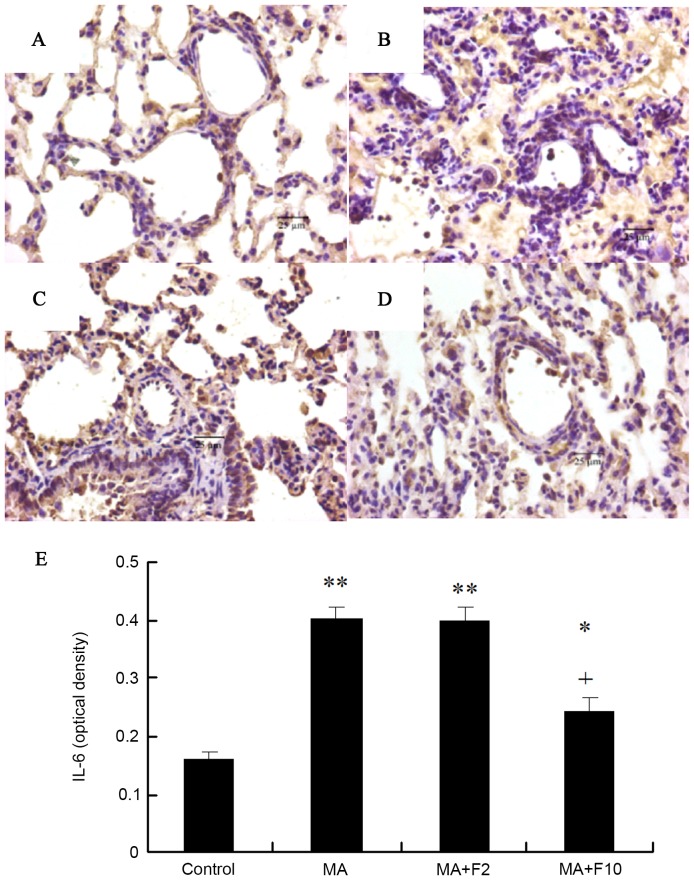
Figure 2.
IL-6 protein expression illustrated by immunohistochemical analysis. (A) Control group, (B) MA group, (C) MA+F2 group, (D) MA+F10 group (magnification, ×400) and (E) IL-6 (optical density). Tissue sections (5 µm) from the different groups were stained with rabbit anti-IL-6 (brown) and counterstained with hematoxylin (blue). The data are expressed as the mean ± standard deviation (n=6; *P<0.05, **P<0.01 vs. the control group; +P<0.05 vs. the MA group). IL-6, interleukin-6; MA, methamphetamine; F2, fluoxetine at 2 mg/kg; F10, fluoxetine at 10 mg/kg.

