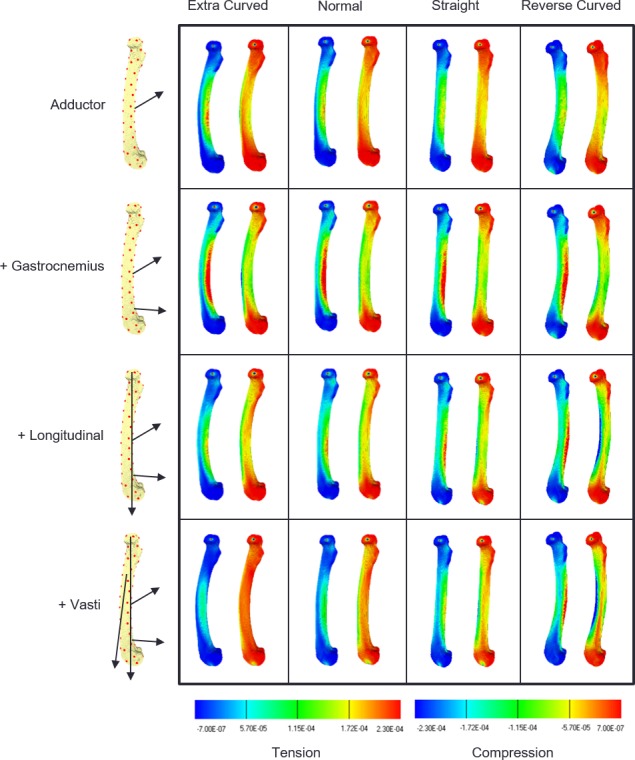
Figure 2. Strain contour maps.

Strain maps of the four models under the cumulative load conditions. The first row, adductors only, then gastrocnemius is added, followed by the longitudinal force and then the vasti. Each panel contains a tension map and a compression map. Regions of high tension in the tensile maps are shown in red. Regions of high compression in the compressive maps are shown in blue. Bending is indicated by a colour gradient across the diaphysis.
