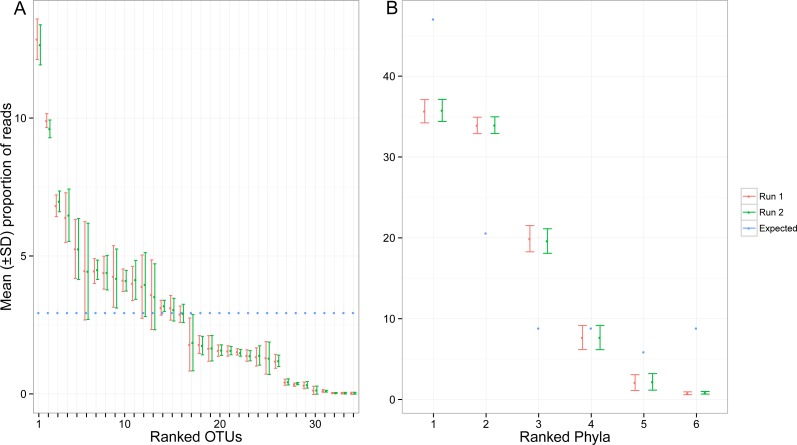
Figure 4. Proportion of reads recovered for each of the target OTUs separately (A) and after combining them per phyla (B).
Mean and standard deviation (SD) were calculated among seven indexed PCRs. The expected proportion of reads was calculated based on the proportion of total genomic DNA pooled (nuclear and mitochondrial DNA). Ranked phyla are as follows: (1) Arthorpoda; (2) Annelida; (3) Chordata; (4) Echinodermata; (5) Mollusca; (6) Platyhelminthes. The identity of the ranked OTUs can be found in Table S1.

