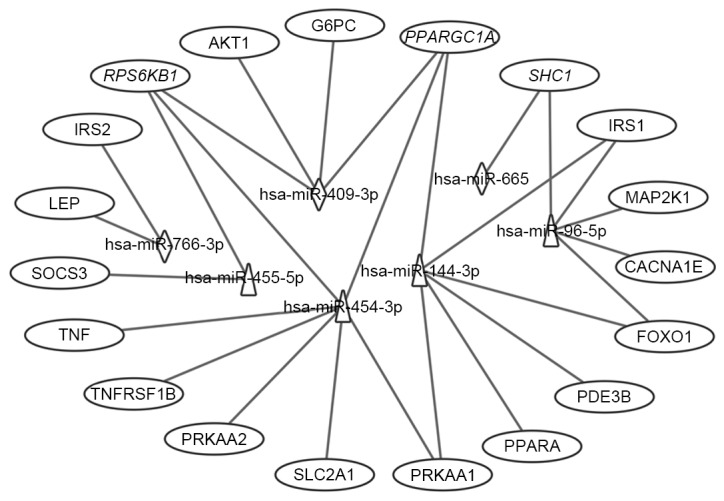
Figure 6.

Interaction networks of the differential miRNAs and their T2DM target genes associated with type II diabetes mellitus, insulin and adipocytokine signaling pathways. Triangles represent upregulated miRNAs; diamonds represent downregulated miRNAs and ovals represent target genes for T2DM. Italics (RPS6KB1, PPARGC1A and SHC1) indicate genes targeted by downregulated and upregulated miRNAs. miR, microRNA; T2DM, type 2 diabetes mellitus; CACNA1E, calcium voltage-gated channel subunit α1 E; TNFRSF1B, tumor necrosis factor α receptor superfamily, member 1B; IRS, insulin receptor substrate; SOCS3, suppressor of cytokine signaling 3; PPARGC1A, peroxisome proliferator-activated receptor γ, coactivator 1α; PPARA, peroxisome proliferator-activated receptor α; PRKAA1, protein kinase, AMP-activated, α1; AKT1, v-akt murine thymoma viral oncogene homolog 1; SLC2A1, solute carrier family 2, member 1; G6PC, glucose-6-phosphatase, catalytic subunit; LEP, leptin; SHC1, Src homology 2 domain containing, transforming protein 1; MAP2K1, mitogen-activated protein kinase kinase 1; RPS6KB1, ribosomal protein S6 kinase, 70 kDa, polypeptide 1; PDE3B. phosphodiesterase 3B; FOXO1, forkhead box O1.
