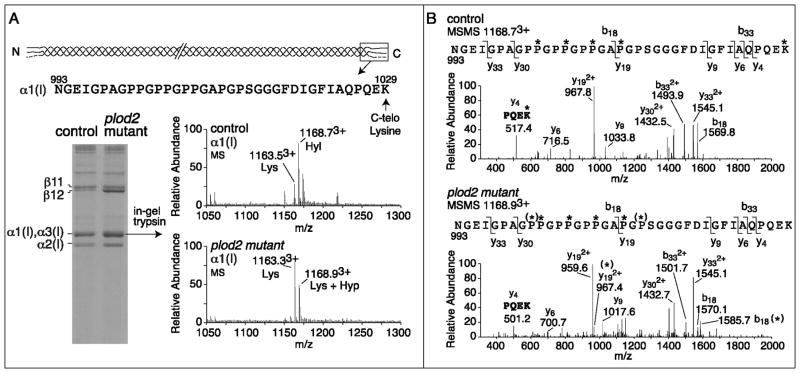
Figure 3. Cross-linking and mass spectral analysis of bone type I collagen.
Collagen was extracted from vertebral bone of 6 month old adult fish (two fish per genotype) and run on SDS-PAGE. In-gel trypsin digestion was performed on individual chains and the degree of hydroxylation of K1029 in the α1(I) C-telopeptide was analyzed by mass-spectrometry. A. SDS-PAGE of heat-denatured collagen shows a higher solubility of collagen, illustrated by an increased α and β band intensity from plod2 mutant fish, compared with control fish. The upper alpha band was shown to contain both α1(I) (65%) and α3(I) (35%) after mass-spectrometry. The sequence given at the top is of the tryptic peptide containing the α1(I) C-telopeptide obtained on mass spectrometry analysis after in-gel trypsin digestion. The lysine residue indicated (C-telo Lysine, K1029) is subject to hydroxylation by lh2. The MS spectra show the presence of both lysine (Lys) and hydroxylysine (Hyl) at K1029 in control, while in plod2 mutant fish Hyl was not detected. The molecular ions 1163.53+, 1168.73+, 1163.33+ and 1168.93+ are labeled as Lys, Hyl, Lys and Lys + Hyp respectively based on the MSMS fragmentation analysis shown in panel B. B. The fragmentation spectra (MSMS) of 1168.73+ from control α1(I) and 1168.93+ from plod2 mutant α1(I) confirms the loss of K1029 hydroxylation in plod2 mutant fish (see y4 fragment ion in plod2 mutant (501.2) and y4 (517.4) in control, K = Lys, K*= Hyl). Partial prolyl hydroxylation [illustrated by (*)] at both P1001 and P1013 was revealed by the fragmentation spectra to be the source of the additional 16 mass units in the plod2 mutant bone peptide by the MSMS spectra [see y192+ with and without (*) and b18 with and without (*)].

