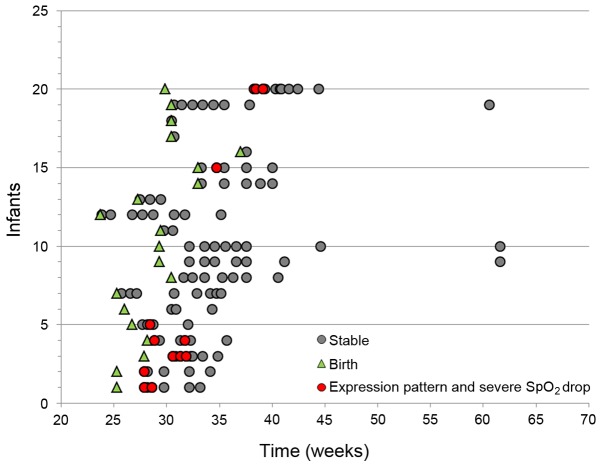
Figure 2.
Sampling times for all samples (n=107) according to age of the infants. Each infant is indicated on the y-axis (n=20). All samples (n=107; the red and grey dots) are indicated on the x-axis according to the postmenstrual age of the infants. For each infant, the GA at birth is marked by green triangles. Samples representing time points when the infants received continuous oxygen therapy and transient hypoxia are indicated by red dots (n=13). Sampling times when the infants were not continuously oxygenated and had no events of transient hypoxia (stable) are indicated by grey dots (n=94). GA, gestational age; postmenstrual age of infants=GA+chronological age (weeks).

