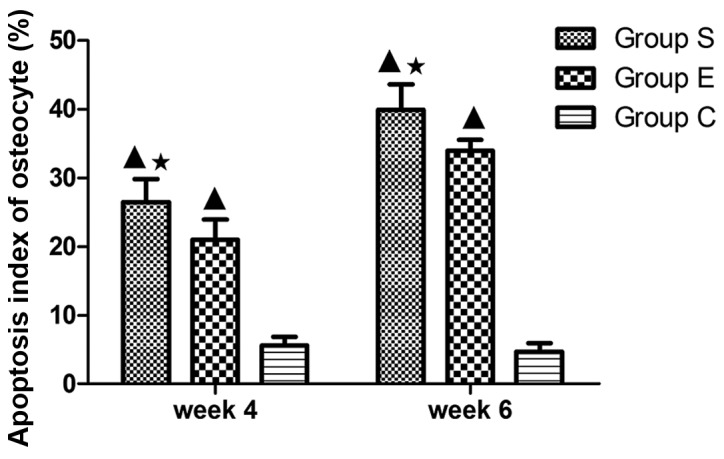
Figure 4.

Levels of apoptotic cells in the three groups at weeks 4 and 6. In group S, the apoptosis index of osteocyte demonstrated significant differences compared with group C at weeks 4 and 6 (P<0.01); compared with the group E, there was a statistical significance at weeks 4 and 6 (P<0.05). Values are expressed as mean ± standard deviation (n=8). ▲P<0.01 vs. group C; *P<0.05 vs. group E. Group S, steroid group; group E, vitamin E-treated group; group C, control group.
