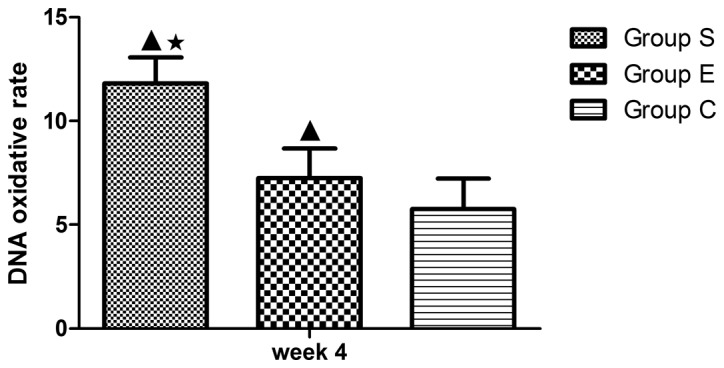
Figure 8.

DNA oxidative damage rate of marrow bone hematopoietic cells in the three groups at week 4. In group S, the DNA oxidative damage rate of marrow bone hematopoietic cells demonstrated significant differences compared with group C at week 4 (P<0.01); compared with the group E, there was a statistical significance at week 4 (P<0.05). Values are expressed as mean ± standard deviation (n=8). ▲P<0.01 vs. group C; *P<0.05 vs. group E. Group S, steroid group; Group E, vitamin E-treated group; Group C, control group.
