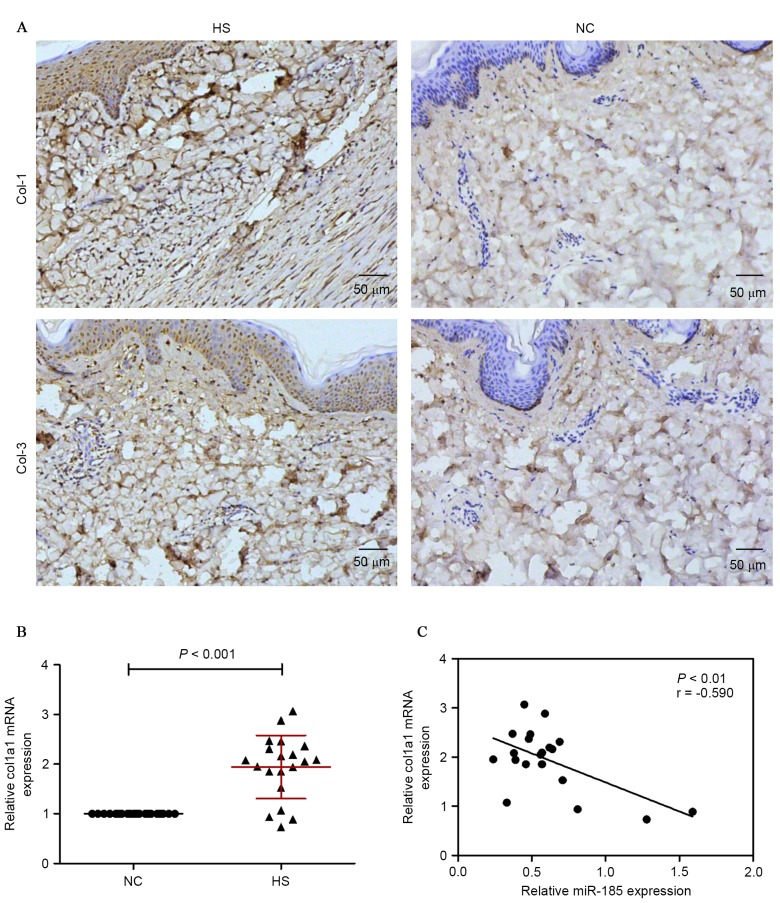
Figure 3.
Col-1 and Col-3 expression were measured by (A) immunohistochemical staining in HS and NC tissues (magnification, ×100). (B) mRNA expression of Col-1 was examined by RT-qPCR. (C) Inverse correlation of miR-185 and Col-1 expression in HS tissues. Col, collagen; HS, hypertrophic scarring tissues; NC, corresponding adjacent normal tissues; RT-qPCR, reverse transcription-quantitative polymerase chain reaction; miR, microRNA.

