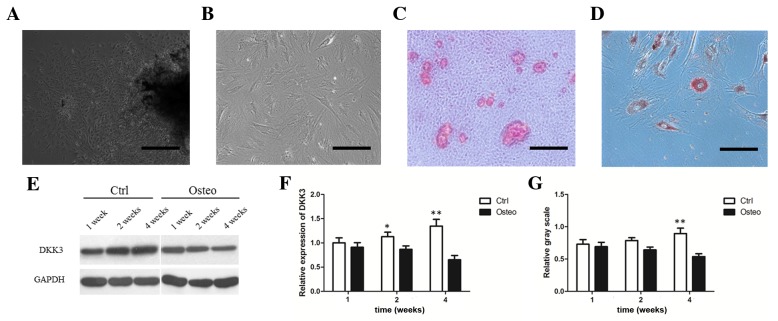
Figure 1.
DKK3 expression in DFCs during osteogenic differentiation. (A) Primary culture of DFCs after 3 days. Scale bar, 200 µm. (B) Most DFCs at passage 3 presented fibroblast-like features. Scale bar, 100 µm. (C) Mineral deposits on DFCs grown in osteogenic medium for 3 weeks, as detected by Alizarin Red staining. Scale bar, 100 µm. (D) Adipocytes stained with Oil Red O following adipocyte induction for 4 weeks. Scale bar, 100 µm. (E) WB analysis demonstrating DKK3 protein downregulation following osteogenic differentiation. (F) DKK3 mRNA downregulation following osteogenic differentiation. (G) Relative gray scale of DKK3 expression determined following WB analysis. *P<0.05, **P<0.01 vs. Osteo. DKK3, Dickkopf-related protein 3; DFCs, dental follicle cells; WB, western blot; Control, DFCs grown in 10% Dulbecco's modified Eagle's medium; Osteo, DFCs grown in mineral induction medium.

