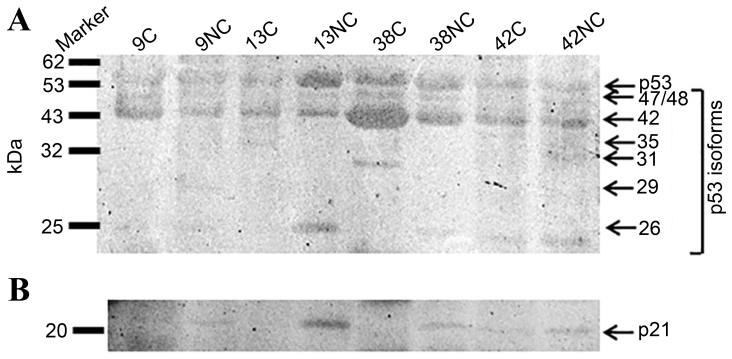
Figure 3.
Western blot analysis of (A) p53 and (B) p21 proteins in C and NC specimens. The samples represent varying levels of Δ133p53 transcript expression: High (samples 13 and 42); low (sample 38) and intermediate (sample 9). Molecular weight markers are displayed on the left, whereas the predicted isoforms and corresponding molecular weights (kDa) are displayed on the right. Positive samples are indicated with arrows corresponding to their molecular weights in A. p53 was present at 53 kDa and its isoforms with variable molecular weights, and p21 is presented in B at 21 kDa. C, carcinoma; NC, adjacent normal lung specimens.

