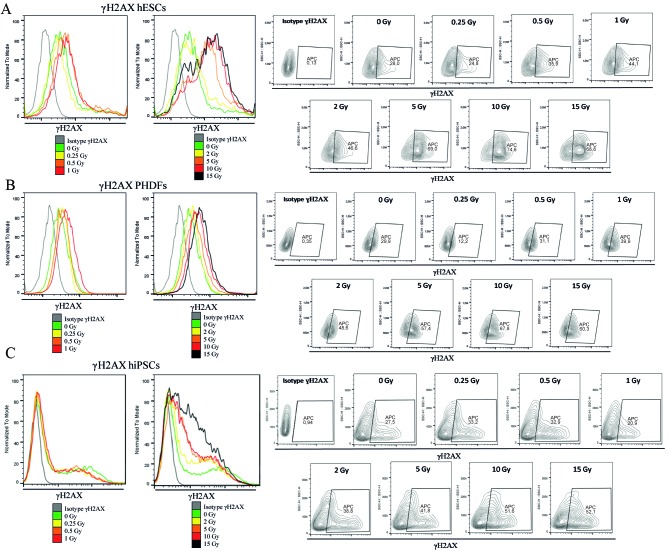
Figure 4.
Visualization of DNA DSBs as γH2AX in irradiated cells. Representative contour plots and histograms for (A) hESCs, (B) PHDFs and (C) hiPSCs demonstrate the changes in the level of DSBs following ionizing radiation for each of the 3 cell lines. DSBs, double strand breaks; γH2AX, phosphorylated H2A histone family member X; SCs, stem cells; hESCs, human embryonic SCs; PHDFs, primary human dermal fibroblasts; hiPSCs, human induced pluripotent SCs; Gy, gray; APC, allophycocyanin.

