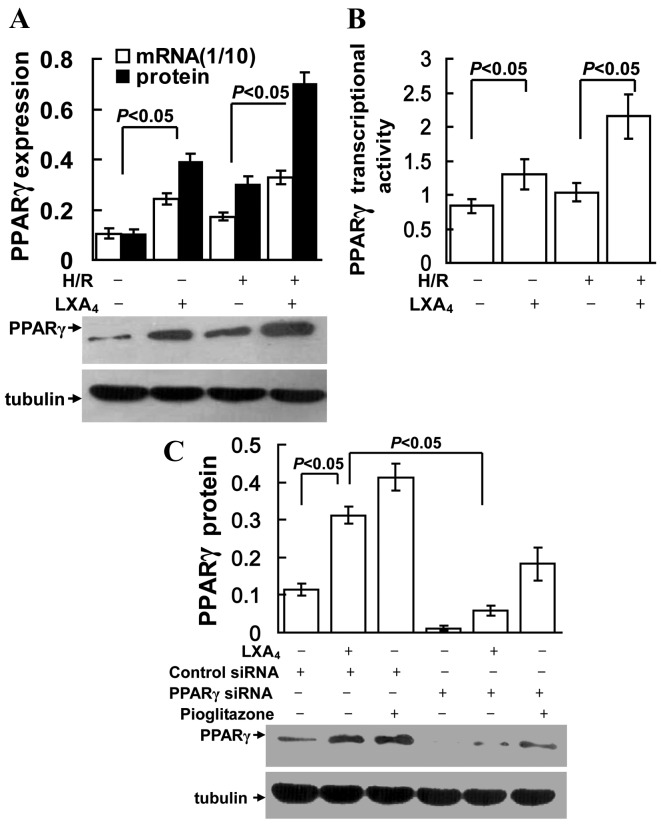
Figure 2.
Upregulation of PPARγ expression and activity due to LXA4 treatment in HK-2 cells. Cells were pretreated with 10 nM LXA4 for 12 h, PPARγ siRNA or control siRNA transfection, or 10 µM pioglitazone for 12 h, and then exposed to H/R. (A) mRNA expression of PPARγ was determined using quantitative PCR. The amount of PCR products was normalized to GAPDH to determine the relative expression ratio (mRNA expression ratio ×1/10) for each mRNA. For western blot, tubulin protein was used as a loading control. (B) PPARγ transcriptional activity was expressed as 450 nm value of PPARγ/control. (C) Nuclear protein expression levels of PPARγ are presented as PPARγ/tubulin ratio for each sample. Data are presented as the mean ± standard deviation of 5 independent experiments. PPARγ, peroxisome proliferator-activated receptor-γ; siRNA, small interfering RNA; H/R, hypoxia/reoxygenation; LXA4, lipoxin A4; PCR, polymerase chain reaction.

