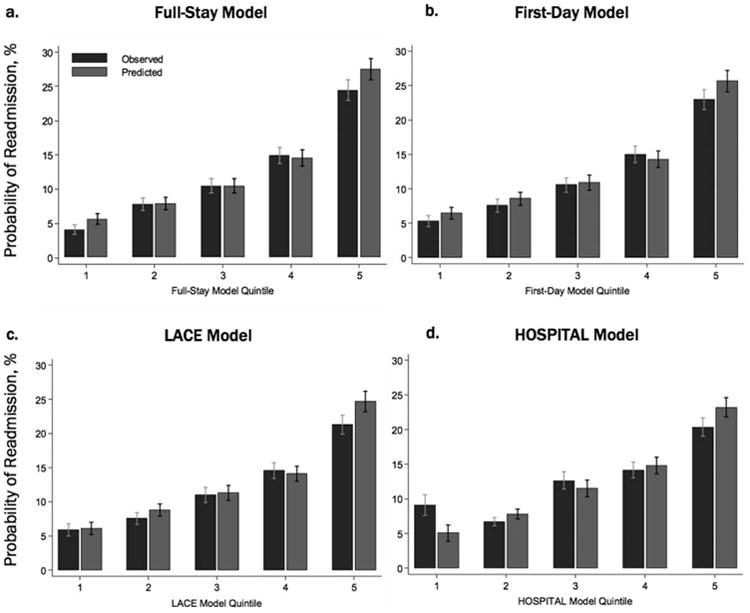
Fig. 1.

Comparison of the calibration of different readmission models. Calibration graphs for full-stay (a), first-day (b), LACE (c), and HOSPITAL (d) models in the validation cohort. Each graph shows predicted probability compared to observed probability of readmission by quintiles of risk for each model. The LACE model includes Length of stay, Acute (nonelective) admission status, Charlson Comorbidity Index, and Emergency department visits in the past year. The HOSPITAL model includes Hemoglobin at discharge, discharge from Oncology service, Sodium level at discharge, Procedure during index hospitalization, Index hospitalization Type (nonelective), number of Admissions in the past year, and Length of stay.
