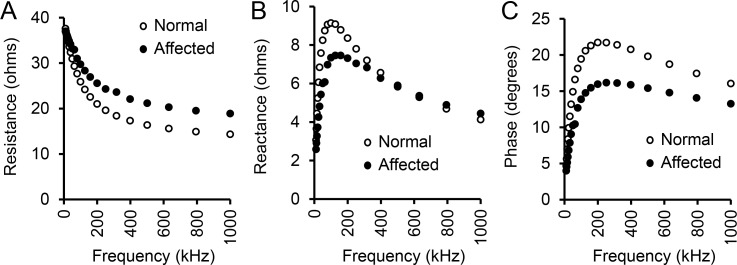
Fig 3. Multifrequency EIM signature in normal and affected dogs.
(A) Relationship between resistance and frequency. (B) Relationship between reactance and frequency. (C) Relationship between phase and frequency. Open circle, normal dogs (n = 10); Closed circle, affected dogs (n = 14). Points represent average values across the population studied.

