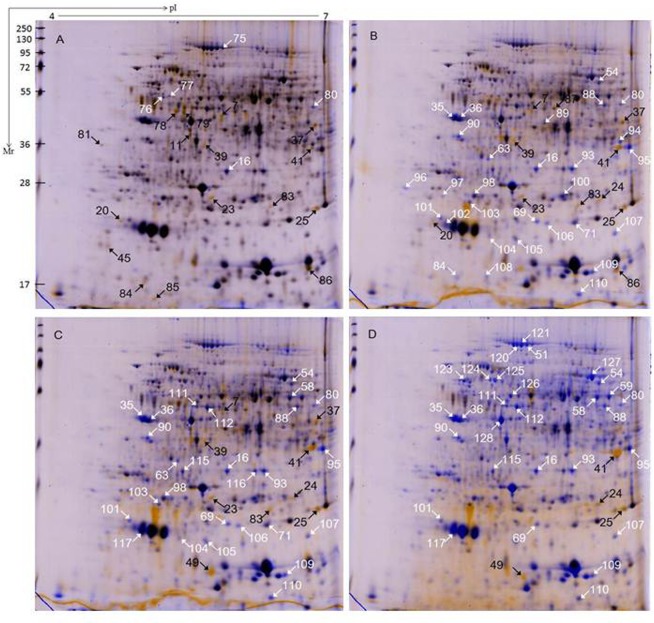
Fig 3. 2-DE analysis of SC9 genotype at the time-points from 0h to 96h.
Total of proteins (300 μg) were loaded on a 13 cm IPG strip with linear gradient (pH 4−7) and SDS-PAGE was performed on a 12% gel. Proteins were stained with CBB G-250. The wrapped 2-DE maps showed the pairwise comparison at the time-points of 24h/0 h (A), 48 h/0h (B), 72h/0h (C) and 96h/0h (D). The white and black arrows indicated proteins that showed detectable changes (>2.0-fold of the normalized volume) in abundance compared with those observed in the control of 0 h; white indicated a down-regulated match, and black indicated an up-regulated match.

