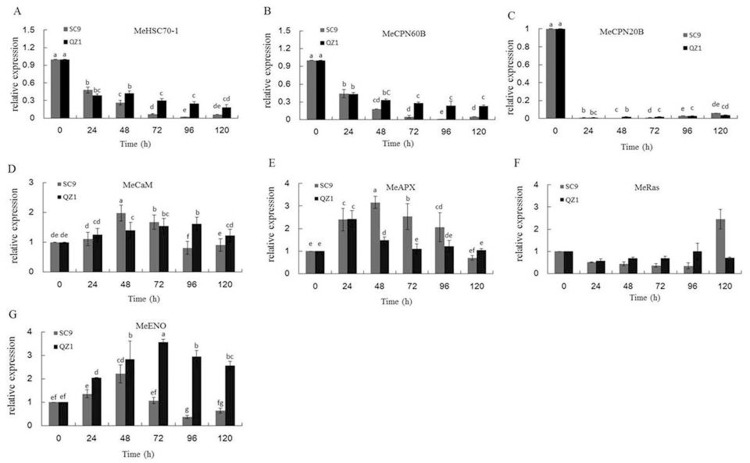
Fig 7.
The expressed levels of genes including MeHSC70-1 (A), MeCPN60B (B), MeCPN20B (C), MeCaM (D), MeAPX (E), MeRas (F) and MeENO (G) in cassava injured storage roots using qRT-PCR. Each bar represents the mean of three independent replicates with standard error. Different letters on the columns indicate the statistical difference at p< 0.05 by SPSS to Duncan’s multiple comparison tests.

