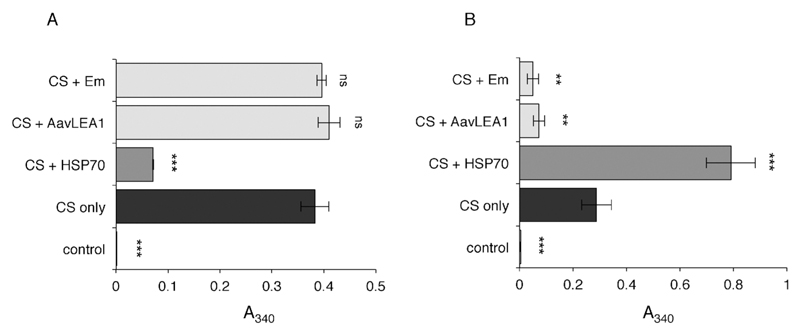
Fig. 1.
Light scattering measured as apparent absorbance (A340) of CS (black bars) after (A) heat stress, or (B) desiccation stress, in the presence of five-fold molar excess HSP70 (dark grey), AavLEA1, or Em (both light grey). Non-stressed CS is taken as control (white). *** denotes significance at p < 0.001 and ** denotes p < 0.01 using one-way ANOVA, plus Tukey post test; ns, not significant.

