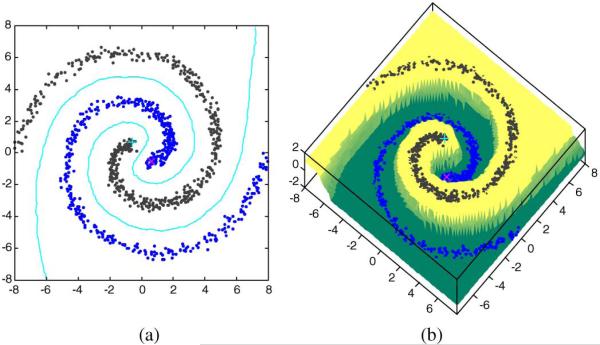
Fig. 3.
Illustration of out-of-sample extension: two-Swiss-roll dataset (a) out-of-sample results in {(x, y)|x ∈ [–8, 8], y ∈ [–8, 8]} using Table 3. The contour lines represent boundary between two classes form by the data points with the estimated label values equal to 0 (b) The z-axis indicates the predicted label values associated with different colors over the region.

