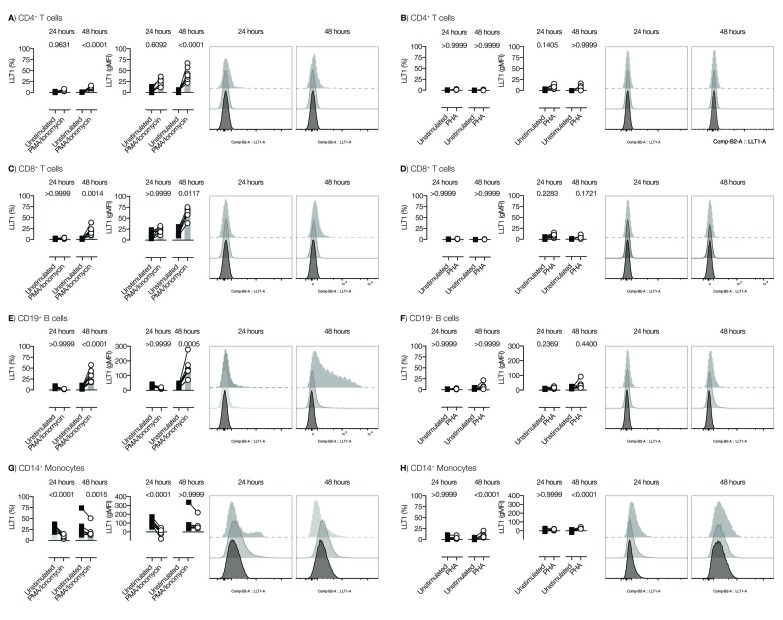
Figure 2. LLT1 on activated PBMCs.
PBMCs were stimulated for either 24 or 48h with PMA/ionomycin or PHA. Lectin-like transcript 1 (LLT1) expression on different cell subsets was measured by FACS, and presented as the percentage of LLT1+ cells (left hand graphs) or the gMFI of LLT1 expression (middle graphs) within the given populations. Representative histograms showing isotype control (after 48h; light grey), or LLT1 expression at 24h (dark grey) and 48h (black) are shown in the right hand plots. Two-way ANOVA with Bonferroni’s multiple-comparisons test were applied (**<0.01, ***<0.001 , ****<0.0001). Data from two pooled experiments.

