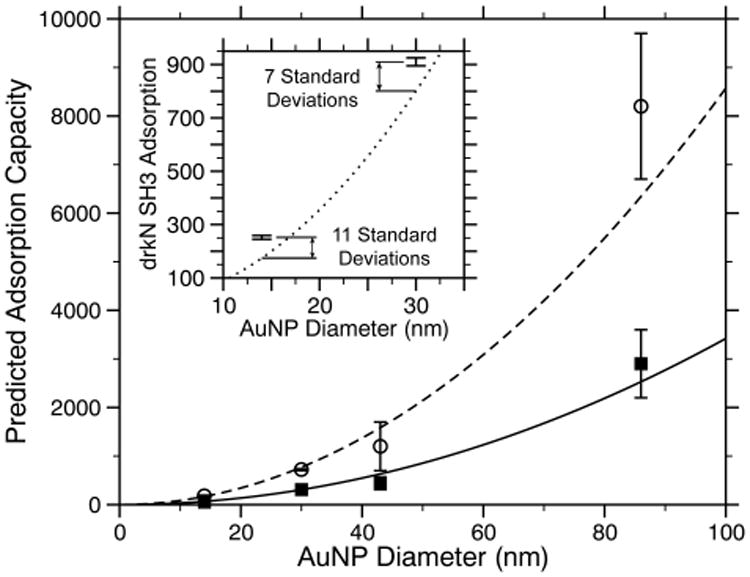
Figure 3.

Comparison of observed versus predicted adsorption capacity for GB3 (○, dashed line) and BCA (■, solid lines). The lines represent a prediction that assumes a globular, densely packed monolayer of proteins on the surface and contains no adjustable parameters. The inset shows a similar prediction for the folded drkN SH3 domain (dotted lines) along with the observed adsorption capacity for drkN SH3 on 14 and 30 nm AuNPs.
