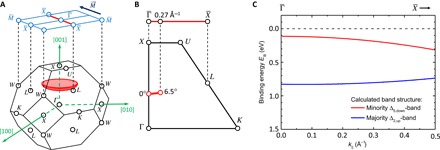
Fig. 2. Investigated region of the band structure.

(A) Bulk (bottom) and surface Brillouin zones (BZ; top) of the Co fct lattice. The red shaded spherical section illustrates the observed region in the Brillouin zone. Note that the central point of the sphere is the Γ point in the Brillouin zone above (not shown) because the value of k⊥ = 2.9 Å−1 for our experimental conditions exceeds the size of the first Brillouin zone with k⊥ = 1.8 Å−1. (B) Cut through the ΓKUX plane of one side of the bulk Brillouin zone and the projection to the surface. The red line represents the region in reciprocal space over which we integrate with our spin detector. (C) Calculated band dispersion for the majority Δ2,up band and minority Δ5,down band by a tight-binding method based on the work of Miyamoto et al. (32).
