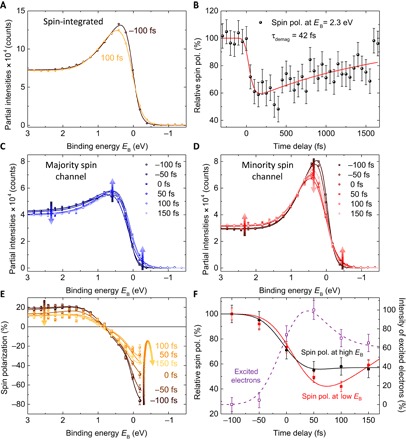
Fig. 3. Spin-resolved photoemission spectra.

(A) Spin-integrated photoemission spectra of Co/Cu(001) (30 ML) before (−100 fs) and after (100 fs) optical excitation. (B) Spin dynamics extracted from the measured spin polarization at EB = 2.3 eV. (C and D) Partial intensities of majority- and minority-spin photoemission spectra as a function of time. Lines correspond to the fits, as described in the text, whereas the arrows indicate a decrease/increase in spectral weight. (E) Transient quenching of the spin polarization. (F) Transient spin polarization extracted from energies around the Fermi level (red squares) and at higher binding energies (black circles), together with the appearance of hot electrons (violet open squares). All lines in (F) are guides to the eye.
