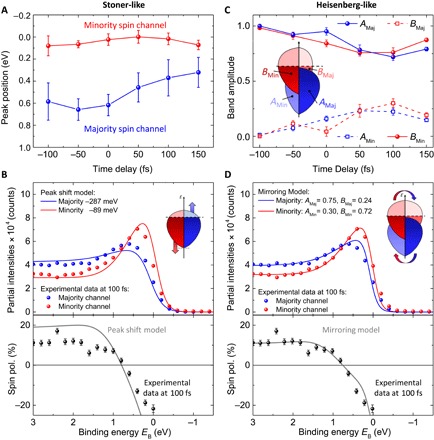
Fig. 4. Analysis of possible exchange collapse versus band mirroring.

(A) Extracted energetic shifts of the majority and minority bands as a function of time. (B) Modeled majority and minority spectra (top) and spin polarization (bottom), if only energetic shifts are considered, in comparison to the measured experimental data at t = 100 fs. (C) Extracted amount of band mirroring. The scaling prefactors AMaj and BMaj (blue solid and red dashed lines) that were multiplied with the unpumped (“initial”) majority and minority spectra, respectively, to fit the data of the majority channel after excitation are shown. One sees that the majority channel loses spectral weight from its initial majority spectrum and gains spectral weight from the initial minority spectrum accordingly. The same was carried out for AMin and BMin in the minority channel (blue dashed and red solid lines). (D) Same as (B), if only band mirroring is considered.
