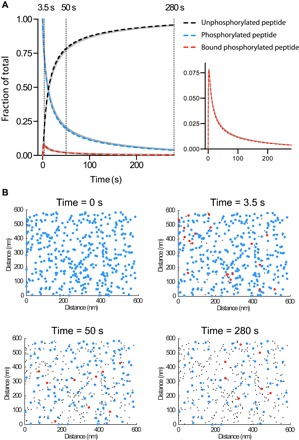
Fig. 3. Mathematical models capture the physics and chemistry in tethered enzymatic SPR.

(A) Levels of unphosphorylated peptide, phosphorylated peptide, and phosphorylated peptide bound to SHP-1 over time determined using the stochastic simulation (solid gray lines) or the MPDPDE model (dashed colored lines). Levels of SHP-1 bound to phosphorylated peptide are replotted for clarity (right panel). Good agreement is observed between the stochastic simulation and the MPDPDE model calculation. (B) Snapshots of the spatial distribution of the three molecular species at indicated time points from the stochastic simulation [colors as in (A)]. Initially, the phosphorylated peptides are randomly distributed on the surface (0 s), but as time progresses, clustered peptides are effectively dephosphorylated by tethered catalysis (50 s), ultimately resulting in phosphorylated peptides too far apart for efficient tethered catalysis (280 s). These two-dimensional spatial distributions are generated from the stochastic simulation by projecting 20 nm in the third dimension. See Materials and Methods for computational details. Parameters: [SHP-1] = 1 μM, [peptide] = 100 μM, kon = 0.1 μM−1 s−1, koff = 1 s−1, = 0.01 μM−1 s−1, L = 20 nm, and = 0.0005 μM−1 s−1.
