
Fig. 4. Fitted biophysical/biochemical parameters are independent of experimental variables.
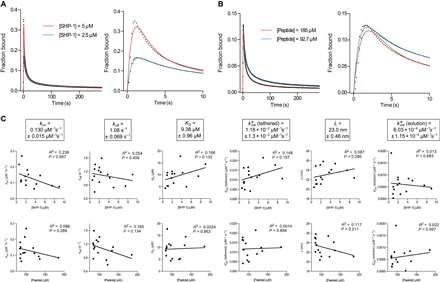
Representative SPR traces (black dots) and MPDPDE model fits (solid color) for (A) two SHP-1 concentrations and (B) two initial peptide concentrations with the right panels showing early time data and fit. (C) Plots of fitted parameters versus SHP-1 concentration (upper row) and peptide concentration (lower row) with linear regression fits (R2 and P values are indicated) reveal a lack of correlation, indicating that the fitted parameters do not depend on the experimental variables. Averages of fit parameters with SEMs from all experiments are shown in boxes (n = 15). All experiments are performed using wild-type SHP-1 and phosphorylated PEG28-ITIM peptides. Exclusion criteria for experiments exhibiting long time scale artifacts, such as nonspecific binding and/or differential flow cell drift, are discussed in Materials and Methods (Quality control) and fig. S6.