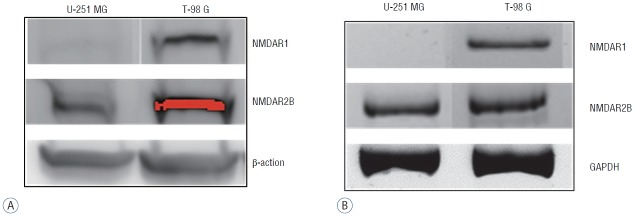
Fig. 2.
Expression levels of NMDAR1 and NMDAR2B in U-251 MG and T-98 G cells. The cell lines were analyzed using western blotting (A) and RT-PCR (B). NMDAR1 was present only in T-98 G cells, but NMDAR2B was detectable in both glioma cell lines. β-actin and GAPDH were used as internal controls. NMDAR: N-methyl-D-aspartate receptor, RT-PCR: reverse transcription polymerase chain reaction, GAPDH: glyceraldehyde-3-phosphate dehydrogenase.

